
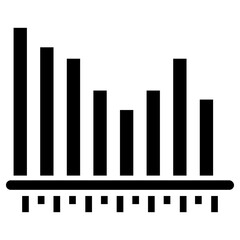
Chart Histogram Beige Fluffy Icon
statistics analytics histogram data analysis
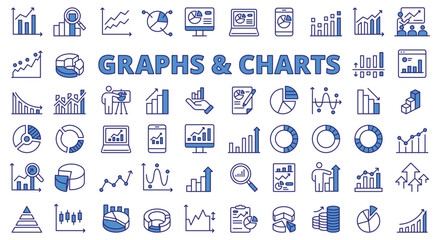
Graphs and charts icon line design blue. Business graph, chart, data, diagram, statistic, pie chart, data visualization vector illustrations. Graphs and charts editable stroke icons.
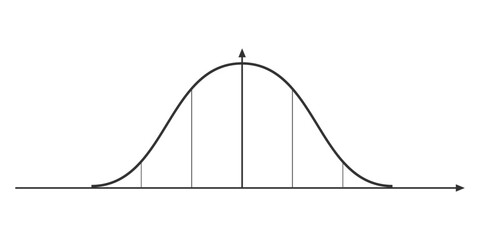
Bell curve graph. Normal or Gaussian distribution template. Probability theory mathematical function. Statistics or logistic data diagram
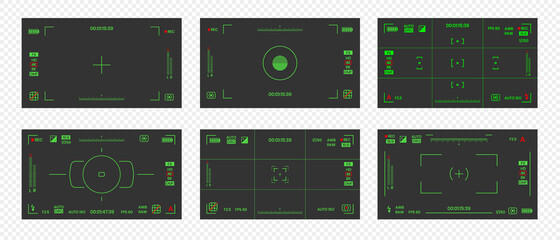
Camera viewfinder night vision video or photo frame recorder flat style design vector illustration set. Digital camera viewfinder with exposure settings and focusing grid template.

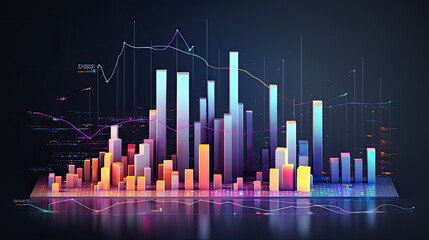
Multifaceted Visual Depiction of Machine Learning Prediction Models with Data Analysis

mano, telefono, affari, economia, contabilità

A histogram of rainfall data with a rising pattern. indicating an increase and richness. The background is a blend of dark grey and black

Financial chart line icon. Neumorphic, Orange gradient, 3d pin buttons. Economic graph sign. Stock exchange symbol. Business investment. Line icons. Neumorphic buttons with outline signs. Vector
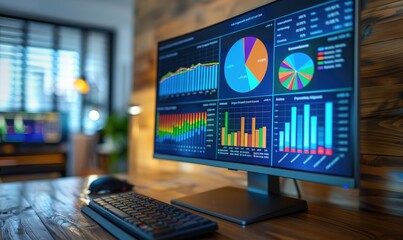
Modern data analysis computer monitor showing histograms and pie charts
histogram filled line icon

Graph and Charts line icons. Vector illustration include icon - data analysis, diagram, stat, histogram, economy outline pictogram for infographic statistic presentation.

Taking a photo with a dslr camera
Chart Histogram Vector Icon

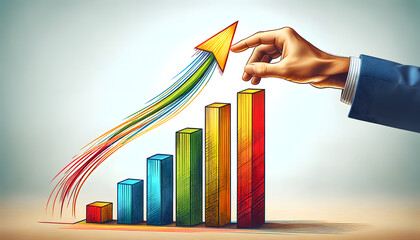
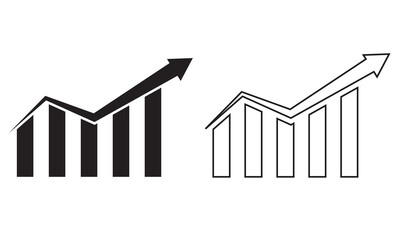
Arrow up and histogram showing profit and income from investment on green minimal background, increase in investment returns or doing business

gantt chart icon, simple vector design
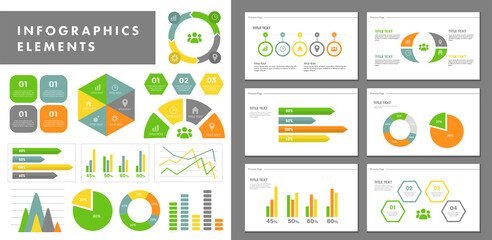
ビジネスシーンで役に立つインフォグラフィック、いろいろなグラフのベクターイラスト、ピクトグラムやアイコンのセット

Business people using tablet computer to make financial investments,created with Generative AI tecnology.

line statistics diagram bar to histogram

Digital background for business presentations in light colors with graphs, charts, charts and histograms on a translucent screen, behind it is a garden with flowers and trees, a big city

Chart Histogram Orange Foil Balloon Icon

Abstract histogram of the graph

A hand of business man point to data histogram tablet illustration design. Generative AI
Histogram of growth, progression graph, data analysis curve, business planning and strategy diagram.
Logo indicateurs de performance.

Multifaceted Visual Depiction of Machine Learning Prediction Models with Data Analysis

A group of people are sitting around a table in a room discussing business plans and using laptop computers.
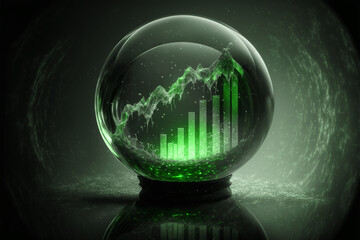
Green stock market chart in a crystal ball representing the prediction of a bull market, illustration, mystery dark background, light reflections and effects, created with generative AI technology
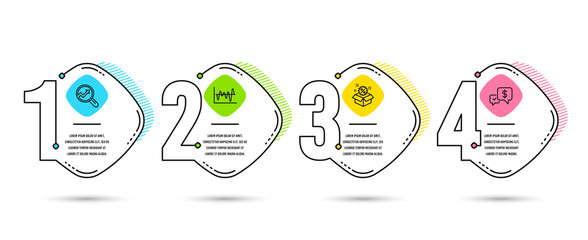
Infographic template 4 options or steps. Set of Analytics, Stock analysis and Sale icons. Payment received sign. Audit analysis, Business trade, Discount. Money. Process diagram, workflow layout

Modern data analysis computer monitor showing histograms and pie charts
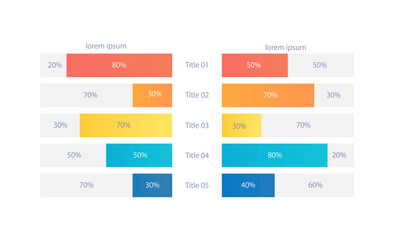
Mirror reflection infographic chart design template. Compare five indicators. Editable infochart with horizontal bar graphs. Visual data presentation. Myriad Pro-Bold, Regular fonts used

Focus on computer screen with increasing graphs and colorful charts of project financial statistics. Focused young businesswoman analyzing marketing strategy sales profitability, economics concept.

Gleaming 3D chart icon showing upward trend placed over a world map
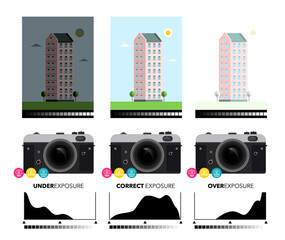
Mirrorless Camera Exposure Settings with Histograms and Building Picture Samples

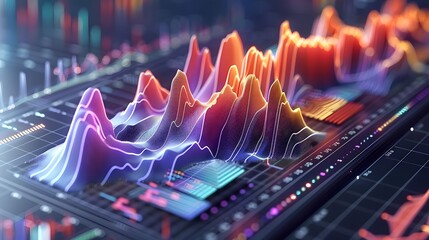
wallpaper of stock market, colorful of stock histogram or graph or chart
histogram icon, simple vector design
analysis bar bar chart bars histogram line icon

Financial investors and stock market trends,created with Generative AI tecnology.

A histogram overlaying the probability density function of a financial variable.

Digital background for business presentations in bright colorful light colors with graphics, diagrams, charts, histograms, exchange rates on the screen in the office. Sheet with color graphs

Transparent frosted glass, technology inspired data histogram
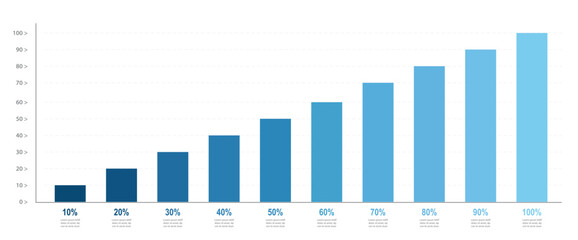
Blue gradient slim chart bars template, 10% to 100% number text. Flat design interface illustration inforchart infographic elements for app ui ux web banner button vector isolated on white background
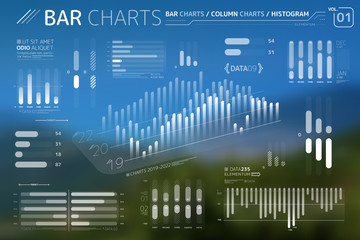
Bar Charts, Column Charts And Histograms Infographic Elements
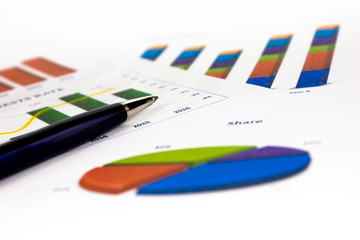
Pie chart and histogram with pen on the table. Picture taken in studio with soft-box.
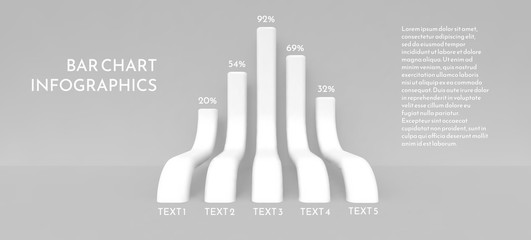
Bar chart in the form of long three-dimensional bending columns.

Statistics icons set
graphs and charts on the dark background

3D Business chart in metallic
Business Statistic and Chart Histogram Icons. Financial Growth Graph and Infographic Symbol.

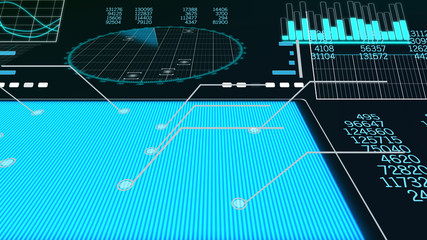
A financial graph on technology abstract background
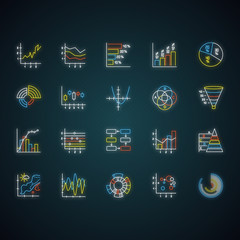
Chart and graph neon light icons set. Pie diagram. Histogram. Area chart. Venn diagram. Pareto curve. Temperature map. Polar watch. Scatter chart. Glowing signs. Vector isolated illustrations
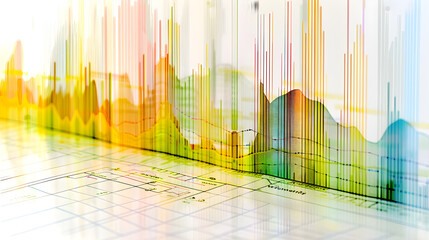
Fluctuating Mortgage Rates Over the Years: A Colorful Graph Analysis

Data driven business analysis laptop dashboard on the wooden table indoors
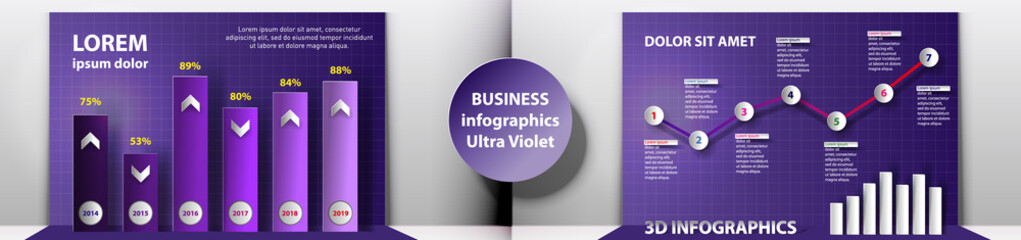
Ultra violet 3D graph and line graph templates, business infographics, vector eps10 illustration

Hand of businessman or investor pointing to data, information, histogram, chart showing financial and business growth and make a plan to reach goal of success
Pixilated Detection Scanner of Aircraft

histogram analytics bars line icon

Stock market quotes on computer screen,created with Generative AI tecnology.

A histogram overlaying the probability density function of a financial variable.
Graph icon. Growing graph icon on white background. Finance icon, bar chart. Chart bar symbol for your web site design, logo, app, UI design. Digital graph icon. Vector illustration
Transparent frosted glass, technology inspired data histogram

A flat illustration of various types of graphs and charts used in business such as pie charts, bar graphs, line graphs and histograms.
Statistics icon abstract blue background illustration design