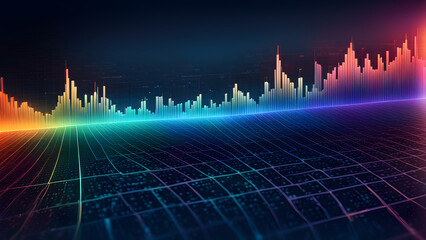
Finance, stock market, and growth graph chart with arrow. Abstract finger touching chart bar. Hologram histogram in technology light blue style. Low poly wireframe modern illustration.

Digital background for business presentations in bright colorful light colors with graphics, diagrams, charts, histograms, currency rates on the screen
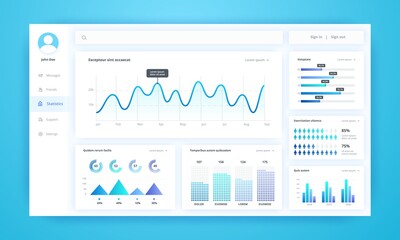
Infographic dashboard. UI kit with diagrams, pie charts, line progress bars and histogram graphs for business presentation. Vector illustration admin panel interfaces elements
Economy arrows and histograms

Hand holding digital histogram show financial and business growth, data and information analysis, strategic planning on business and investment
ビジネスシーンで役に立つインフォグラフィック、いろいろなグラフのベクターイラスト、ピクトグラムやアイコンのセット

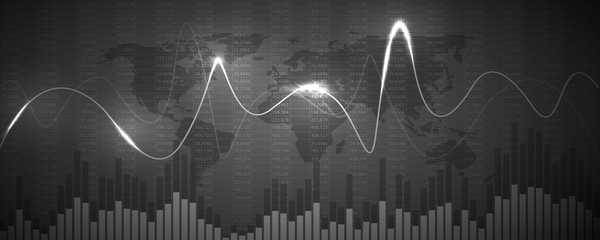
Colorful histograms and curve charts, statistical chart visualization, indicating growing or weakening trends, stock market charts
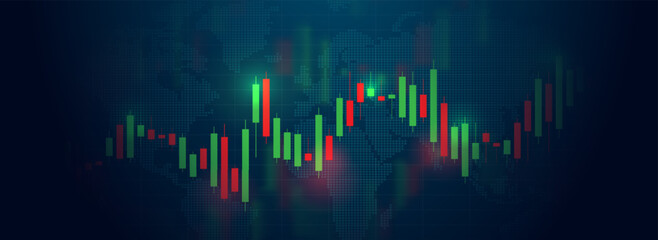
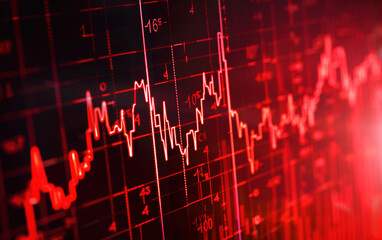
Bear market charts in a trading histogram on a dark blue background. The trend of the global stock market and Forex trading histograms. Charts of economic trends. Vector EPS 10.

Analyse boursière, affaires, finance et investissement, concept

Modern data analysis computer monitor showing histograms and pie charts
Chart Histogram Icon Set. Finance Graph Diagram Sign. Business Growth Statistic Bar Vector Icon suitable for apps and websites UI designs.
Digital multicolored histogram with a growing business concept. Technological diagram, statistics . Camera movement. 3d

mani, telefono, economia, verifica entrate, analisi di bilancio
Abstract histogram of the graph
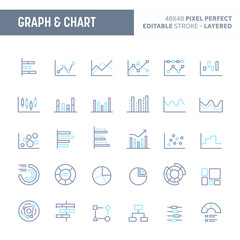
Graph, Diagram & Chart Minimal Vector Icon Set (EPS 10)

minimalist mathematics, hyperbola parabola patterns, kaleidoscopic, copper-leaf on textured dark-teal paper, copy space, 16:9
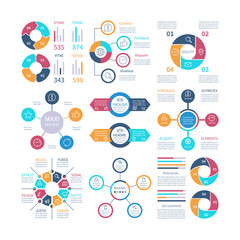
Infographic design. Pie charts and step circle diagram, text layouts bar graphs and histograms. Vector infographics set of color infochart illustration

Sleek workstation with dual monitors showcasing vibrant data analysis graphics, histograms, and pie charts in a modern office setting

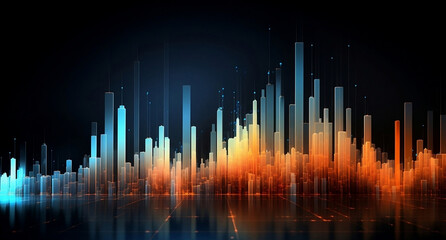
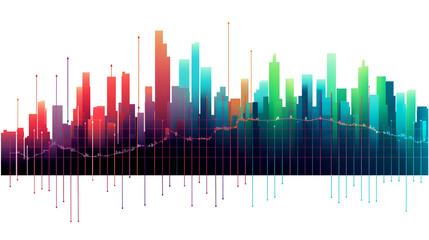
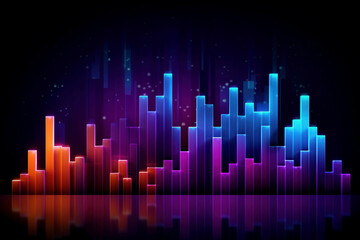
Financial background unites histogram against the background of the night city on the topic of network and trade chart

A volumetric 3D histogram with translucent bars, allowing for the observation of data density and distribution from all angles
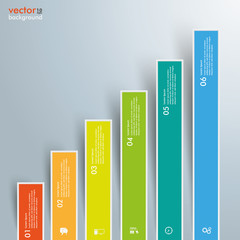
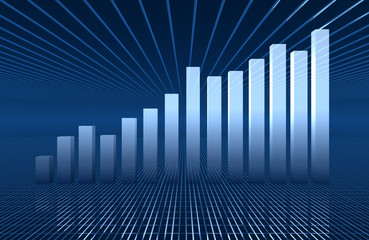
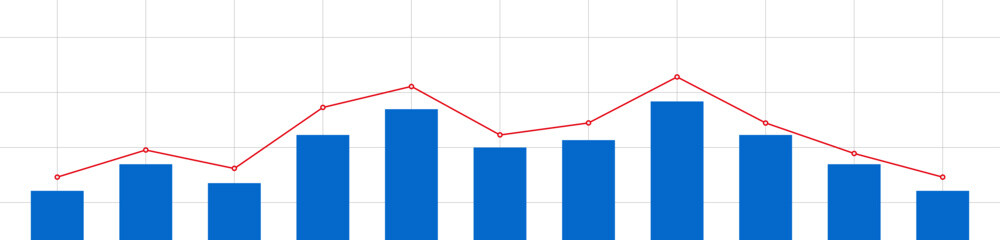
Chart Growth Colored Bars
Colorful dark cool pie chart, visual chart
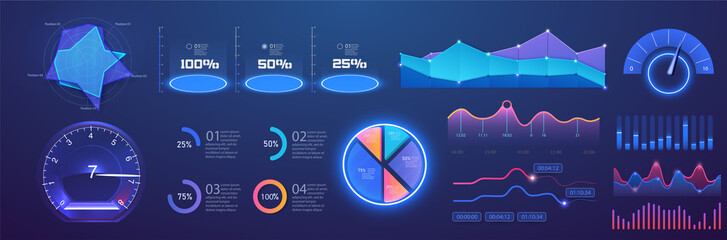
Futuristic neon infographic dashboard template with charts, diagrams elements, online statistics and data analytics. Information panel Mockup. UI, UX,KIT elements design. Vector infographics set.Admin
Histogram of daily trading volumes for a highvolatility cryptocurrency hyper realistic

Hologram histogram show financial and investment growth, working in mobile phone or smartphone show digital financial data or business or investment growth concept

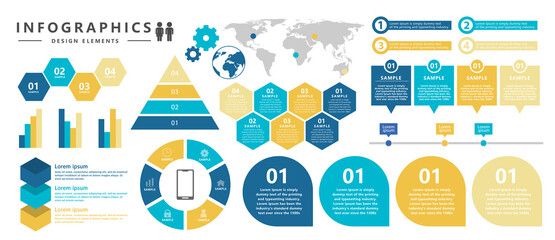
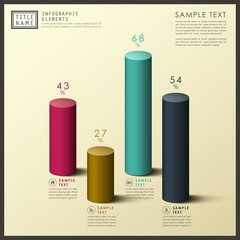
Bar Charts, Column Charts and Histograms Infographic Elements
Multifaceted Visual Depiction of Machine Learning Prediction Models with Data Analysis

Digital background with blue tones for business presentations - a large translucent screen in the office instead of windows with graphics, diagrams, charts, histograms
abstract 3d cylinder infographics
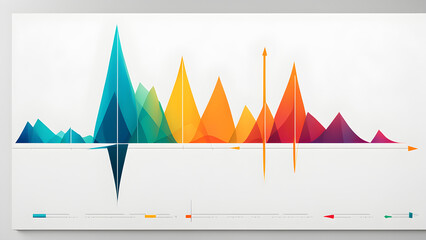
Colorful histograms and curve charts, statistical chart visualization, indicating growing or weakening trends, stock market charts
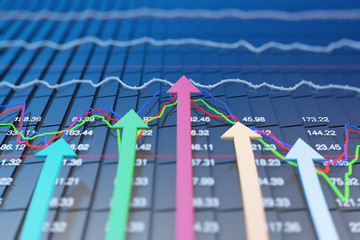
Multicolor Stock Market Bar Graph on white backdrop Ai Generated
histogram sales line icon
icona, mano, grafico, economia, contabilità

A hand of business man point to data histogram tablet illustration design. Generative AI
Stock market quotes on computer screen,created with Generative AI tecnology.
Bar Chart Icon

financial stock market graph on technology abstract background
wykres rosnący i malejący
histogram icon
Color grading tools or RGB colour correction indicator on monitor in post production. Telecine full grade stage in video or film production processing. for colorist edit grading color on digital movie
Bar and Line Charts
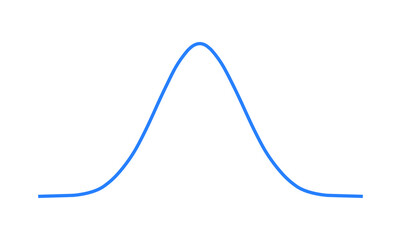
Mathematical Designing of Gaussian Distribution (Bell Curve). Vector Illustration.
Business statistics chart, 3d rendering.

Elegant 3D clay rendering of a histogram with varying heights, placed centrally on a white surface

Hologram histogram show financial and investment growth, working in mobile phone or smartphone show digital financial data or business or investment growth concept
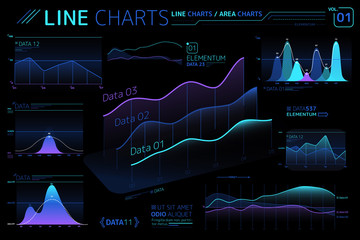
Line Charts and Area Charts Infographic Elements
histograms abstract on blue background
Economy arrows and histograms
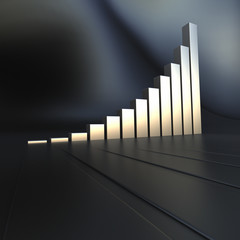
3D Business chart in metallic 02
Colorful histograms and curve charts, statistical chart visualization, indicating growing or weakening trends, stock market charts

Camera histogram icon

Comprehensive Illustration of Kolmogorov-Smirnov Test Statistics and Result Interpretation

grafico, freccia, economia, finanza,
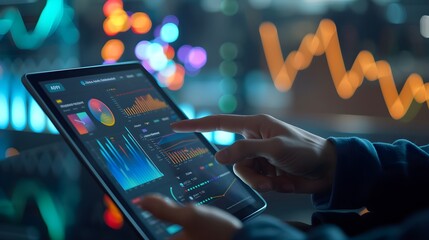
A hand of business man point to data histogram tablet illustration design. Generative AI

Business people using tablet computer to make financial investments,created with Generative AI tecnology.
Graph, financial chart. Graph and growth lines on white background. Vector illustration.

3D rendering neon holographic phone symbol of pie chart icon on dark background

Neon graph on the background of trees. Wallpaper. Generative AI
Financial data graph chart, vector illustration. Abstract background with graph chart finance. Business concept.
Futuristic glowing blue diagram growth chart symbol on black dark background, Generative AI
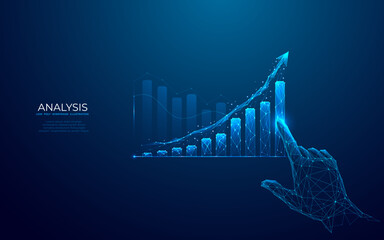
Growth graph chart and up arrow. Abstract finger touching on chart bar. Histogram in technology light blue hologram style. Finance and stock market concepts. Low poly wireframe vector illustration.
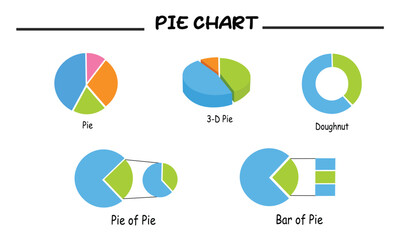
Different types of pie chart and graph vector set. Data analysis, financial report, business analytics illustration. Infographic. Statistics graph. Pie chart icon. Pie graph clipart.
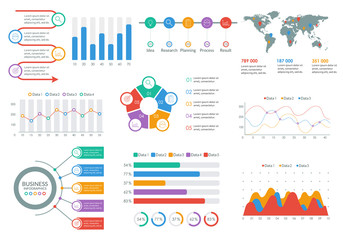
Infographic elements set. Infographics Dashboard template with graph, flow chart, diagram. Business report and presentation design. Modern UI graphic data. Vector illustration.