
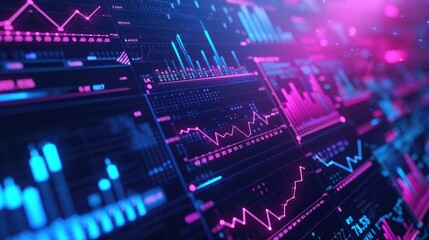
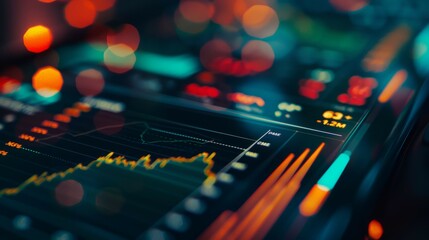
digital screen displaying real-time Bitcoin trading charts and graphs, with glowing neon lines on a dark background to represent the volatility and digital essence of cryptocurrency trading
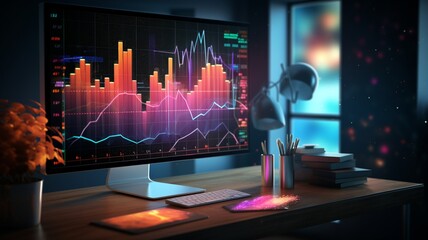
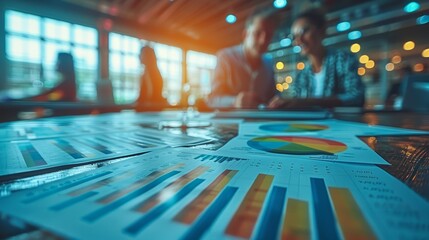
Close-up of magnifying glass on business financial papers with charts and graphs

Close up view of a smartphone displaying a digital banking app with holographic financial charts floating above it set against the backdrop of a busy cityscape symbolizing the accessibility

Man looking at computer blue screen with charts and data
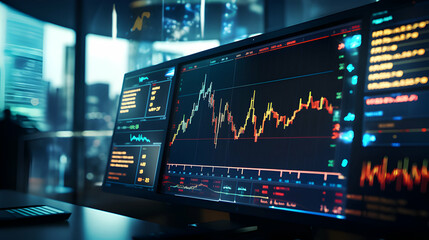
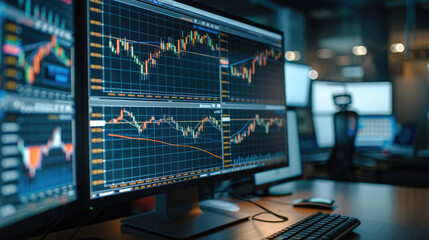
graph of the stock, cryptocurrency, forex, and gold markets on screen, with various technical analysis tools applied, traders and investors analyze price patterns, identify trends

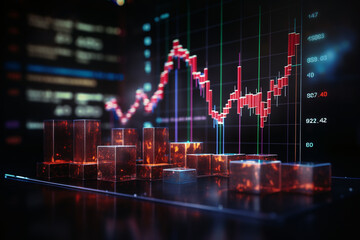
Gold trade chart stock analysis on growth financial business money market 3d background with profit investment exchange graph data concept and global economy currency diagram price marketing research
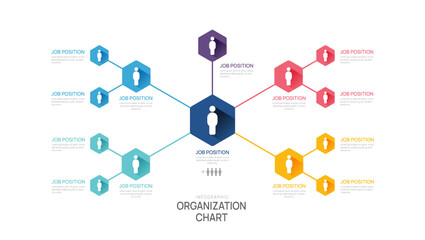
Infographic template for organization chart with business avatar icons. vector infographic for business.
financial charts are showing in the abstract background, Representation of data analytics,charts, graphs and data driven insights emerging from a sea of information

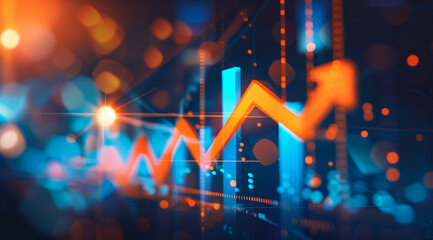
An arrow soaring upwards towards the sky, piercing through clouds, with growth charts and forecasting data in its trail.
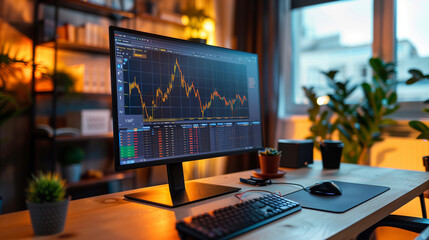
Computer screen/monitor with stock trading charts standing on a desk with typical desk staff like coffee cup and paper work.

Trader with financial charts colorful funky cartoon illustration, learning the crypto market and diving into the world of finance

A focused group of professionals engaged in analyzing financial charts and data during a collaborative team meeting.

Stock trading investor, trader or broker analyst working analysing exchange market using computer investing money in financial market analyzing charts data looking at computer screen.
Digital visualization of financial growth, with glowing charts and graphs in cyberspace.

sustainable investment concept as financial charts

financial charts on the table
Business, science, finance, marketing, graphic resources concept. Big data analysis colorful report. Neon colored info graphic with graphs and charts

Young man wearing casual clothes looking at a very large screen showing stock market charts with candlesticks, view from behind. Generative AI.

topographic contour background. contour lines background. Topographic map background. abstract wavy background. Topographic map contour background.

A computer screen shows various charts and graphs, and businesspeople are moving and discussing marketing data in the background.

A robot trader working on the stock market using artificial intelligence. Artificial intelligence in business, fintech. Artificial intelligence looking at trading charts information. Neural networks

Business Strategy, A group collaboratively working on business development with charts and laptops.
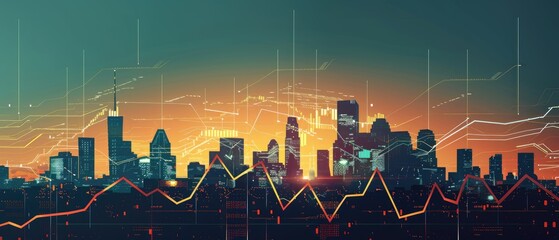
A minimalist graphic of upward trending financial charts merging into a city skyline

Dynamic charts and graphs illustrating the dynamic nature of scientific progress, accented by digital indices in the background. 32K.

person working on a laptop which displays various colorful charts and graphs indicating some data analytics or business performance metrics.
A close-up view of a computer screen displaying various graphs. This image can be used to illustrate data analysis, financial reports, business growth, or technology advancements
AI financial metrics graphs charts computer screen image Ai generated art

Barrels of oil with charts and graphs of stock market as a concept of raw material. Financial world crisis concept. Up of oil price, market grow up.

A digital human figure in athletic wear running on an indoor track, with data visualizations of various health and fitness charts behind it.
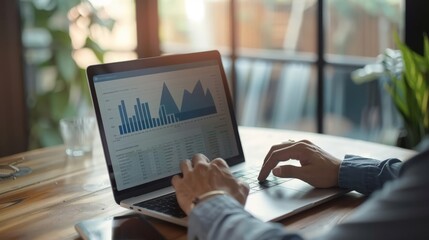
Professional analyzing data charts on a laptop in a well-lit office space.

Stock market growth charts graphs 3d futuristic finance economy business datum diagram marketing illustration

Futuristic business background with charts and graphs. 3d rendering,financial graph on technology abstract background represent financial crisis,financial meltdown,financial stock market graph
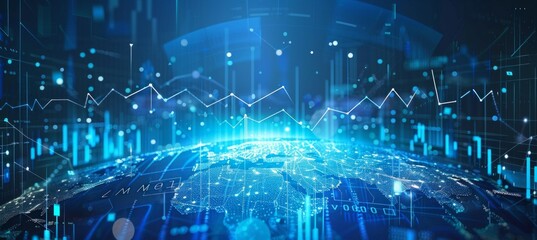
A digital background featuring blue graphs and arrows with the Earth at the center, symbolizing global financial market data or stock trading charts Generative AI

Back view of a businesswoman in front of professional key performance indicator KPI metrics dashboard with screens and charts for sales. A trader or investor looks at stock quotes.

A collection of sensory-friendly learning materials and resources, including tactile books, noise-cancelling headphones, and visual aids, aimed at providing autistic children with a more engaging.

a digital painting of a blue and orange dragon on a dark background with a caption that reads peace lily.

Noah's Ark, animals from the ark, during the flood.

Financial Data Analysis: A digital abstract concept with charts and graphs representing financial growth and business success
Green stock market chart in a crystal ball representing the prediction of a bull market, illustration, mystery dark background, light reflections and effects, created with generative AI technology

Data analysis and seo on high resolution neon screen with magnifier, charts, and graphs

doodle wave ornament background design
A high-resolution image showcasing a futuristic financial data analytics dashboard with glowing interactive charts and graphs on multiple screens.
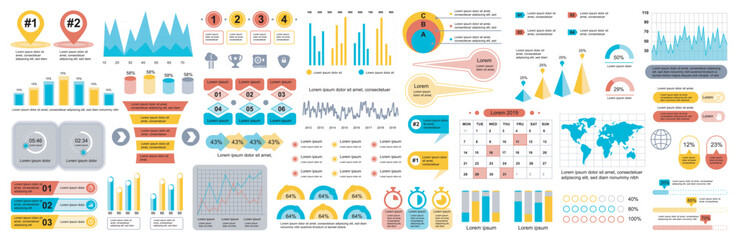
Mega set of infographic elements data visualization vector design template. Can be used for steps, options, business process, workflow, diagram, flowchart, timeline, marketing. Bundle info graphics.

Financial Advisor Explaining Tax Systems A financial advisor explaining complex tax systems to clients, with documents and charts Suitable for financial advisory firm marketing

two professionals, a man and a woman, examining a tablet with serious expressions on their faces in a high-tech control room with multiple screens displaying various graphs and data visualizations
Business charts with arrows, a graph showing an upward trend in sales or wholesome growth, indicating positive financial growth. background material for financial newspapers.
Dynamic business team engagement with colorful analytical charts

Businessman analyzing market trends and charts on a large monitor.

A man interacts with holographic stock market charts above a modern desk in a futuristic workspace. Concept Futuristic Workspace, Holographic Technology, Modern Desk, Stock Market Charts

Focused businesswoman analyzing interactive financial charts on a touchscreen, involved in strategic planning and data analysis - AI generated

Trader with financial charts colorful funky cartoon illustration, learning the crypto market and diving into the world of finance

Working all day...Side view of tired young businessman or trader working with charts on computers at his modern office.
Price charts on the computer screen in a big business office. Generative AI.
A detailed close-up of a digital tablet screen displaying vibrant financial charts and data analysis in a dynamic and colorful presentation.

A minimalist design combines with advanced technology to create an intuitive finance dashboard. Users can seamlessly toggle between line graphs pie charts and heat maps providing
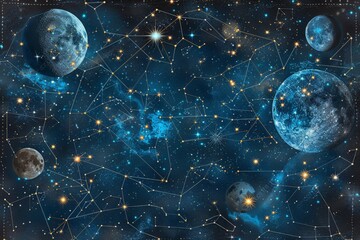
a detailed star chart with constellations and celestial bodies, educational and aesthetic for astronomy enthusiasts

Investment Graph On Smartphone A 3d Illustration business money tech
A picture of an area with lots of financial charts, in light blue and navy style, financial charts showing what is happening in the business, statistics on the chart screen of business and financial a

futuristic healthcare concept with humanoid diagnostic medical robot viewing charts on virtual screen

abstract image of the world of finance and investments. colorful and bokeh effect. online finance and business concept as background image.
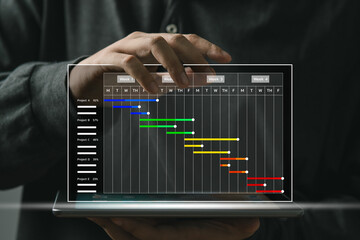
business project manager update work task and milestone progress planning. Businessman using technology software app in tablet with Gantt chart schedule virtual diagram screen.
Simple circle chart

ネオン, 光, 光線, グラフィック素材, 壁紙, 曲線, カラフル, generative ai