
An aerial shot capturing the rise and fall of candlestick charts, symbolizing the volatility and opportunities in financial markets.

A minimalist representation of a stock market graph with jagged peaks and valleys, illustrating the volatility of financial markets

A crystal ball reflecting the highs and lows of the stock market

Electrifying moment of a Bitcoin coin amidst a storm, representing the BTC halving event in the digital currency world
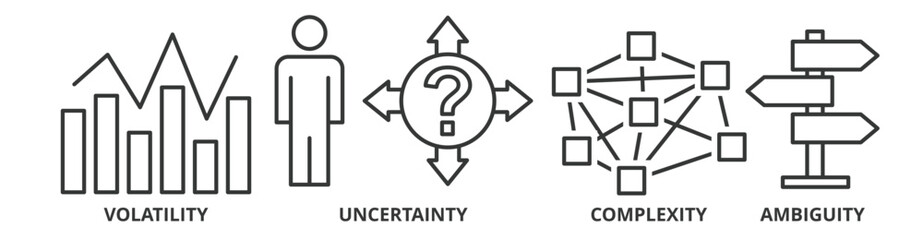
VUCA banner web icon vector illustration concept to describe or reflect on the volatility, uncertainty, complexity, and ambiguity of general conditions and situations

A dynamic 3D graph showing real time stock market fluctuations with peaks and troughs embodying the volatility and excitement of trading

High volatility concept image with colorful volatile gas and board sign with written words High Volatility for finance and trading price variations

Visual metaphor for market fluctuation, with wavy lines and fluctuating graphs in abstract form

Abstract visualization of market volatility with dynamic glowing financial graphs on a dark background, signifying economic fluctuations - AI generated
Cryptocurrency Market Volatility Detailed photographs capturing the fluctuations and volatility of cryptocurrency mark AI generated illustration

Investor using phone to trade stocks online with virtual graphs representing stock market movements. Concept Stock Market Analysis, Online Trading, Investment Strategies, Virtual Graphs

Dynamic depiction of abstract investment market volatility and stability

Traders in a chaotic exchange floor with high investment risk

A close-up view of a sleek stock market chart, featuring minimalist design elements and precise data points for clarity.

Financial catastrophe concept with Bitcoins and debris flying chaotically.

Blockchain technology in action secure transactions on digital ledgers reliable and futuristic
Financial stock market on a laptop screen. Stock market curve on screen. Investing in the stock market. Sotck exchange. Stock market training.

A 3D glass sculpture of rising and falling forex trading graphs embodying the volatility and beauty of the forex market

Techno currency investment and bitcoin trading, with an electronic piggy bank next to cryptocurrency on a digital background

Energetic stock market graph reminiscent of a pulsating heartbeat, showcasing the vitality of financial activity.

Dynamic stock market graphs and charts in vibrant colors illustrate financial data analysis and trends. Bright lines depict fluctuating stock values, with peaks and troughs indicating performance.

An abstract representation of the stock market's volatility, with bold, erratic strokes conveying the highs and lows of financial trading.

digital screen displaying real-time Bitcoin trading charts and graphs, with glowing neon lines on a dark background to represent the volatility and digital essence of cryptocurrency trading

Short Term Trading, Depict the fast paced nature of short term trading in financial markets, emphasizing quick decision-making and high volatility

Dynamic collision of Bitcoin and meteor-like rocks amidst fiery explosion representing market volatility

Dynamic cryptocurrency market trends visualization featuring Bitcoin Ethereum fluctuating graphs digital landscapes and VR interfaces

lone figure standing atop mountain peak, swirling vortex of bitcoin, stormy sky overhead crackling with lightning. disruptive potential of decentralized finance in reshaping the financial landscape.

Market volatility abstract curves

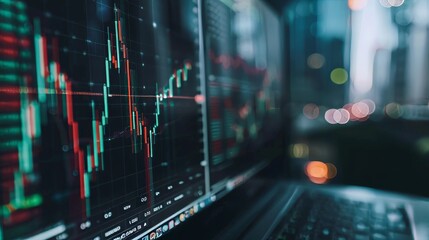
A close-up of a computer screen displaying real-time stock market data and charts, highlighting the volatility and dynamics of financial markets.

Stock market investment graph showing a downward trend Ideas about business investment trends Financial stock market graph on abstract technology background.

High volatility concept image with colorful volatile gas and have board, on a pink background.

Abstract representations of the blockchain as a strong, unbreakable chain or a fortress, symbolizing the inherent security features of blockchain technology against market volatility and cyber threats

Cryptocurrency with blockchain technology creates Digital assets that cannot be duplicated

Finance and Economy Market volatility Explore the theme of market volatility in the finance and economy sector through a series of interconnected images that depict the chaos and unpredictability of f

Computer monitor showing rising candlestick charts with bullish trend, representing volatility trading and recession concept in the stock market.

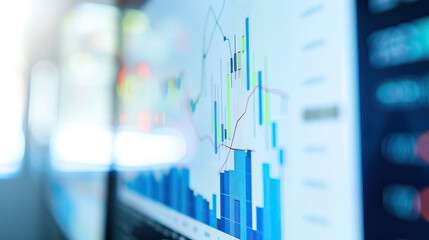
financial stock market graph on technology abstract background

Golden Bitcoin stands amidst a dramatic backdrop of lightning strikes, symbolizing the halving of the mining rewards

graph that represents the volatility of a particular cryptocurrency. generative ai

Dynamic depiction of abstract investment market volatility and stability

A conceptual image featuring the silhouette of a person, chains, and a storm of Bitcoins, possibly representing the volatility of cryptocurrency markets
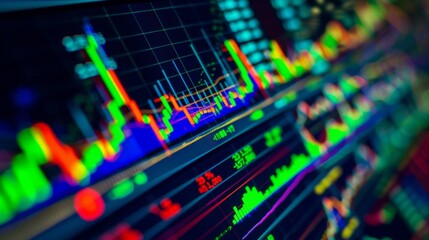
Close-up of complex line chart on a computer screen with peaks and troughs. Graph of volatility showing increased instability in the financial markets and likely recession. Isolated shot with bokeh

Risk Management in Investments: Mitigating Volatility and Protecting Assets

The intertwining of a clock face and a stock market graph highlights the importance of timing within the financial industry.

stick graph chart with indicator showing bullish point or bearish point, up trend or down trend of price of stock market or stock exchange trading, investment and financial concept. thin focus,

Digital image portrays the volatility and dynamism of the financial markets The glowing,neon-like graph against a dark,futuristic background symbolizes the complex data and information

A conceptual representation of fund performance benchmarks and tracking

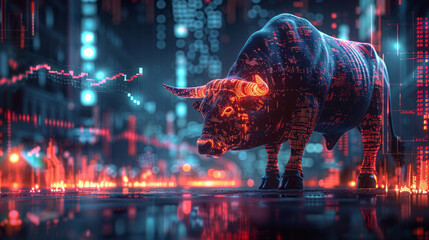
Bull and bear chess pieces on a chessboard, the bull advancing, against financial charts, symbolizing market strategies.
Cryptocurrency. Bull Market. Valotility.
A close-up of a computer screen displaying real-time stock market data and charts, highlighting the volatility and dynamics of financial markets.
Statistics flat icons set. Graph, chart, cloud analysis, survey, prediction, web statistics icons and more signs. Flat icon collection.

Tumultuous Waves of Data Driven A Dynamic Abstract Portrayal of Market Volatility

Bitcoin coin in stormy seas, metaphor for cryptocurrency market volatility and uncertainty

An options trader analyzing volatility levels and implied probabilities, crafting complex trading strategies. Concept of derivatives trading and risk hedging. Generative Ai.

An aerial shot capturing the rise and fall of candlestick charts, symbolizing the volatility and opportunities in financial markets.

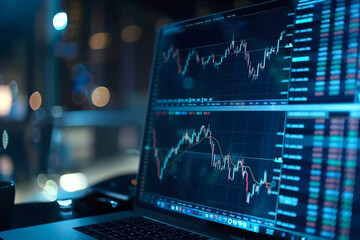
Technical chart Stock Exchange Traders and Investors Using Sophisticated Computer Software to Monitor, Research and Predict Live Market Financial Data Behavior on Computers

Cryptocurrency market impact on traditional stock exchanges, a visual exploration of integration and volatility hyper realistic

Bitcoin trading charts and graphs, with glowing neon lines on a dark background to represent the volatility and digital essence of cryptocurrency trading. digital finance, market trends

Exploring how sentiment analysis on social media influences stock market behavior through datadriven articles and case studies. Concept Sentiment Analysis, Social Media, Stock Market Behavior

Stock Market Ticker Display- Showing a digital display of real-time stock market quotes and indices, highlighting market volatility and fluctuations.

Animated stock market graph pulsing with the highs and lows of financial activity, resembling a dynamic heartbeat.

Market volatility graph, bull and bear phases highlighted, analytical approach, clear visuals

A computer screen filled with multiple lines and dots, representing complex data and patterns, A scatter plot showing the correlation between market volatility and trade volume, AI Generated

Stock market chart lines Trendlines Price action Market sentiment Trading strategies black background