
Unrecognizable female analyst browsing business infographics during working process with statistics online report on digital tablet, trader checking web graphic charts via app on modern touch pad
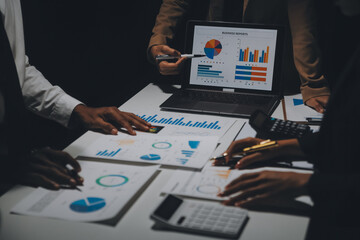
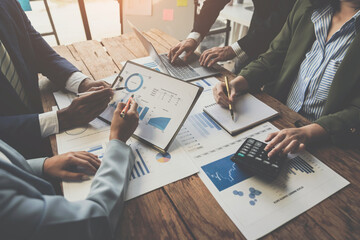
Financial analysts analyze business financial reports on a digital tablet planning investment project during a discussion at a meeting of corporate showing the results of their successful teamwork.
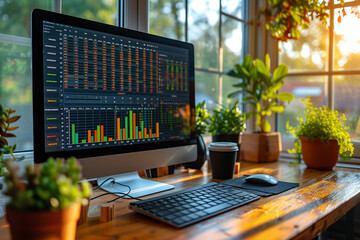
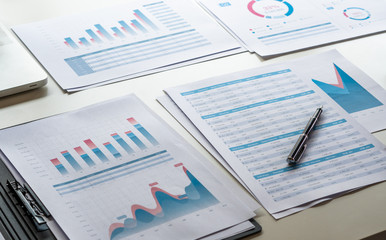
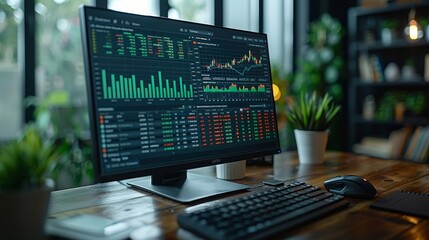
Station de travail dans un bureau à la maison avec graphiques, courbes et statistiques à l'écran, audit et rapport d'analyse, reporting et indicateurs de mesure de performance d'entreprise

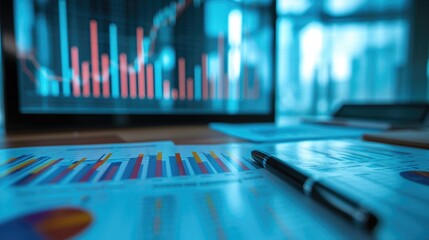
Abstract financial chart with upward trend line and bar graph on dark background
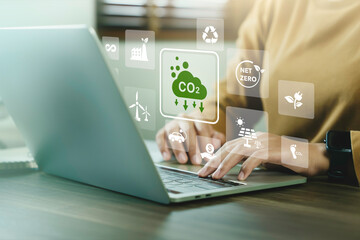
Company use computer report results to reduce CO2 emissions carbon footprint climate change and Net zero to limit global warming. Sustainable development and innovation green business concept.
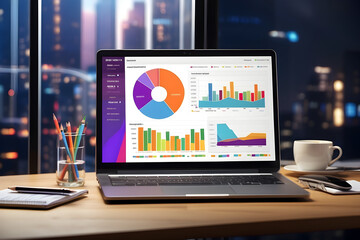
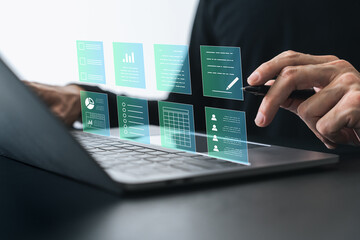
Analyst uses a laptop Showing business analytics dashboard with charts, metrics, and KPI for operations management.Data analysis.sales, marketing. Generative AI
businessman working calculate data document graph chart report marketing research development planning management strategy analysis financial accounting. Business office concept.

Asian businessman or lawyer working and reviewing document reports at office workplace. legal expert, professional lawyer reading and checking financial documents or insurance contract before sign

Multiracial analyst team use BI dashboard data to analyze financial report on meeting table. Group of diverse business people utilize data analysis by FIntech for business marketing decision. Concord
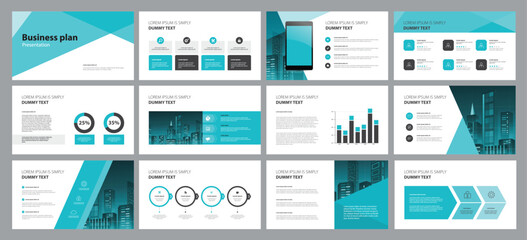
business presentation template design backgrounds and page layout design for brochure, book, magazine, annual report and company profile, with infographic elements graph design concept
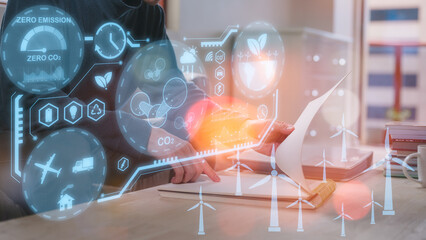
Reduce CO2 emissions and carbon footprint to limit global warming and climate change. Sustainable development and green business, man pointing at report and virtual diagram showing co2 emission icon
Financial analyst analyzes business finance reports on laptop and graph documents during corporate meeting discussions showing successful teamwork, business meeting ideas, marketing.

Cutting-edge medical science or cardiac cardiology. Generative Ai.
Corporate business annual report cover, brochure or flyer design. Leaflet presentation. Catalog with Abstract geometric background. Modern publication poster magazine, layout, template. A4 size
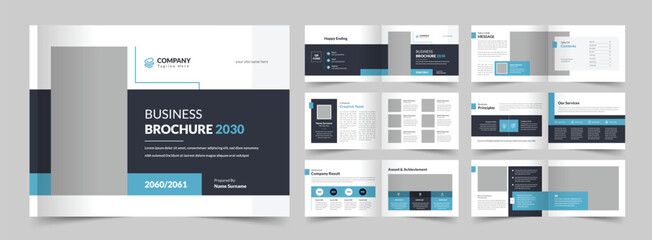
set of bifold brochure template design with minimalist and clean style use for presentation and annual report

Businessman tracking key performance indicators to ensure success, generative Ai

Woman scientist person research writing document science study datum in modern laboratory, professional female doctor working on medical test lab note report health technology development analysis

Business, finance, investment, currency exchange concepts, accounting using calculators to make financial reports, economic growth charts, financial background
Businessman working on tablet with business and financial paperless report file, contract, plan, data and information. .Online e-document management and paperless workflow or office concept

Smiling young professional woman reviewing financial documents at her workplace with laptop and coffee cup.

economic graph includes diagrams, business and financial principles and reports, and the stock market crash

Analyzing results, an accountant, businessman or financial expert analyzes results. Calculates results from graphs, business reports and financial charts. Company stock market.

Business consultants delving into financial reports and market graphs. Strategic Analysis

analyst manages the system database, analysis data plans, and reports. shows a dashboard chart on the computer. concept of analytics business, research on platform digital technology
Analyst working in Business Analytics and Data Management System to make report with KPI and metrics connected to database. Corporate strategy for finance, operations, sales, marketing, generative ai

Financial analysts analyze business financial reports on a digital tablet planning investment project during a discussion at a meeting of corporate showing the results of their successful teamwork.

Financial analysts analyze business financial reports on a digital tablet planning investment project during a discussion at a meeting of corporate showing the results of their successful teamwork.
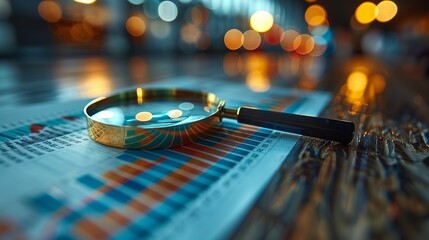
Checking financial reports with graphs and charts, with documents and a magnifying glass on a gray reflection background.

Stack overload document report paper with colorful paperclip place on office desk, paperless business concept.

Team of professionals in a meeting, engaging with charts and reports on the table, brainstrom strategic planning and teamwork.
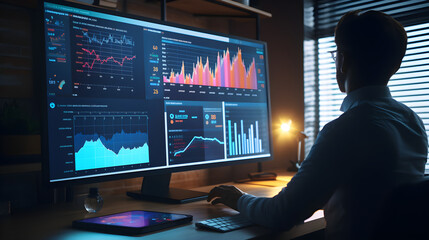
Analyst uses a computer displaying a business analysis dashboard with charts, metrics and KPIs to analyze performance and create information reports for operations management.Data analysis.sales, mark

Financial analyst analyzes business finance reports on laptop and graph documents during corporate meeting discussions showing successful teamwork, business meeting ideas, marketing.
The analyst uses Business Analytics and Data Management Systems to create reports containing KPI's and metrics linked to the company database. He is responsible for the corporate strategy for finance,

Hispanic Female Senior Data Scientist Reviewing Reports Of Risk Management Department On Big Digital Screen In Monitoring Room. Diverse Consulting Company Employees Working Behind Desktop Computers

Businessman works on laptop showing business analytics dashboard with charts, metrics, and KPI to analyze performance and create insight reports for operations management. Data analysis concept. AI G
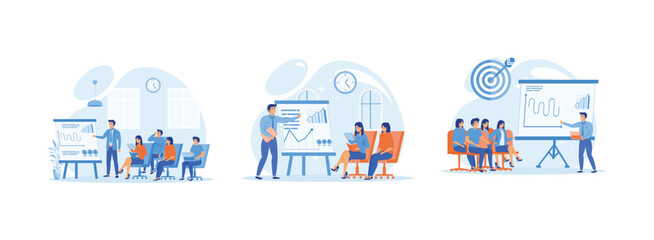
Mentors present graphs and reports of seminars, training, presentations or conferences, Supervisor Gives Presentation in Business Seminar, Using Pie Chart, training on marketing, sales and e-commerce.

Financial data graph chart report statistic marketing research development planning management strategy analysis accounting. Financial business technology hologram concept. Comeliness

Businesswoman calculating financial reports with a calculator and examining market data, generative ai
a4 business annual report template design with minimalist layout style use for company profile and portfolio
Result report icon set. Review document icon vector illustration. Business analysis concept.

Close-up view of business professionals' hands working with financial reports and a laptop on a desk in a corporate setting.

Finance team analyzing budgets and financial reports for strategic planning

Seasonal corporate sustainability reports highlight business practices' year-round impact on the environment.

Review, team and meeting with stats and graphs of company target, goals or market research with data analysis. Above, table or paperwork report of growth, progress or startup performance analytics

Audit document icon in flat style. Result report vector illustration on white isolated background. Verification control business concept.

A young man marketer using a tablet for analyzing trends, with a backdrop of a digital marketing workspace

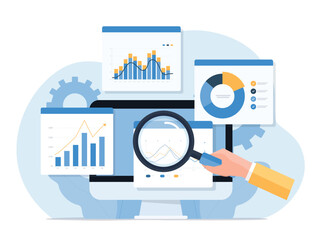
Financial Analysis: An individual analyzing financial data, with graphs, charts, and reports spread out on a desk or displayed on a monitor
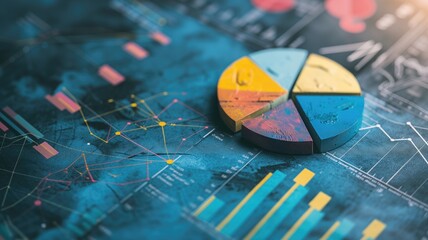
Colorful pie chart on a complex data background

A diverse group of crypto traders engrossed in researching reports and witnessing growth trends. Crypto traders engrossed in researching reports and witnessing growth trends

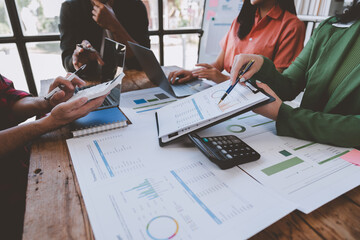
Business People Meeting to analyse and discuss and brainstorming the financial report chart data in office Financial advisor teamwork and accounting concept.
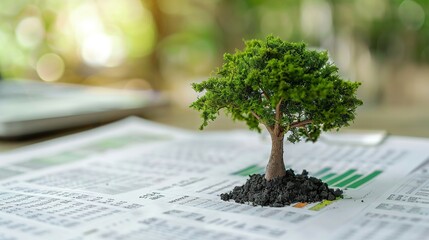
Analyst charts sustainable growth miniature trees sprouting from financial reports
Analyzing results, an accountant, businessman or financial expert analyzes results. Calculates results from graphs, business reports and financial charts. Company stock market.

A police detective is filling out report papers while examining the crime scene in an apartment
business data analytics design concept. and flat vector illustration business finance investment monitor report dashboard.

Corporate Sustainability Reporting Directive (CSRD) Concept. The European Union and financial reporting standards regarding sustainability disclosures.

Abstract modern black background. Minimal. Dark grey banner with geometric shapes, lines, stripes. Design. Futuristic. Modern black background template for documents, reports and presentations.

Diverse group of business analyst team analyzing financial data report paper on office table. Chart and graph dashboard by business intelligence analysis for strategic marketing planning Habiliment

A conceptual representation of fund performance benchmarks and tracking

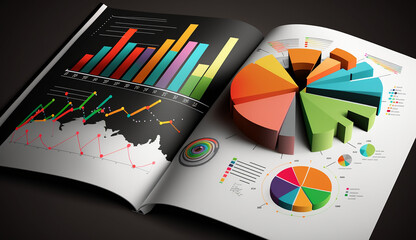
In-depth business analysis captured through vibrant pie charts and bar graphs on a document, showcasing data-driven decision making

Corporate, people and meeting in conference room for strategy or collaboration for planning, partnership and conversation. Boardroom, Business employees and reports for b2b discussion for company.
Brochure Template Layout Design, Editable Template Layout, A5 Brochure
Business report. Graphs and charts. Business reports concept, Ai generated image

data visualization with turquoise green blue neon dots connected background banner. hi-tech futuristic illustration with bokeh.